All projects

Case study · Network analysis

ViewerAtlas

Mapping which Twitch channels share an audience

Solo project · May 2025 to present · Python, AWS, React

Twitch shows who's live and how many people are watching. It doesn't show which channels draw on the same people, or whether a scene around a game or a language is a real community or just a category.

ViewerAtlas measures that from chat. Three times a day it records who chats in the roughly 1,200 most-watched live channels. Two channels are linked by the number of chatters they share, and the Louvain algorithm finds communities in the resulting graph. The results are published as an interactive map at vieweratlas.space.

Research question

Which Twitch channels share an active audience, and do those shared audiences form recognizable communities?

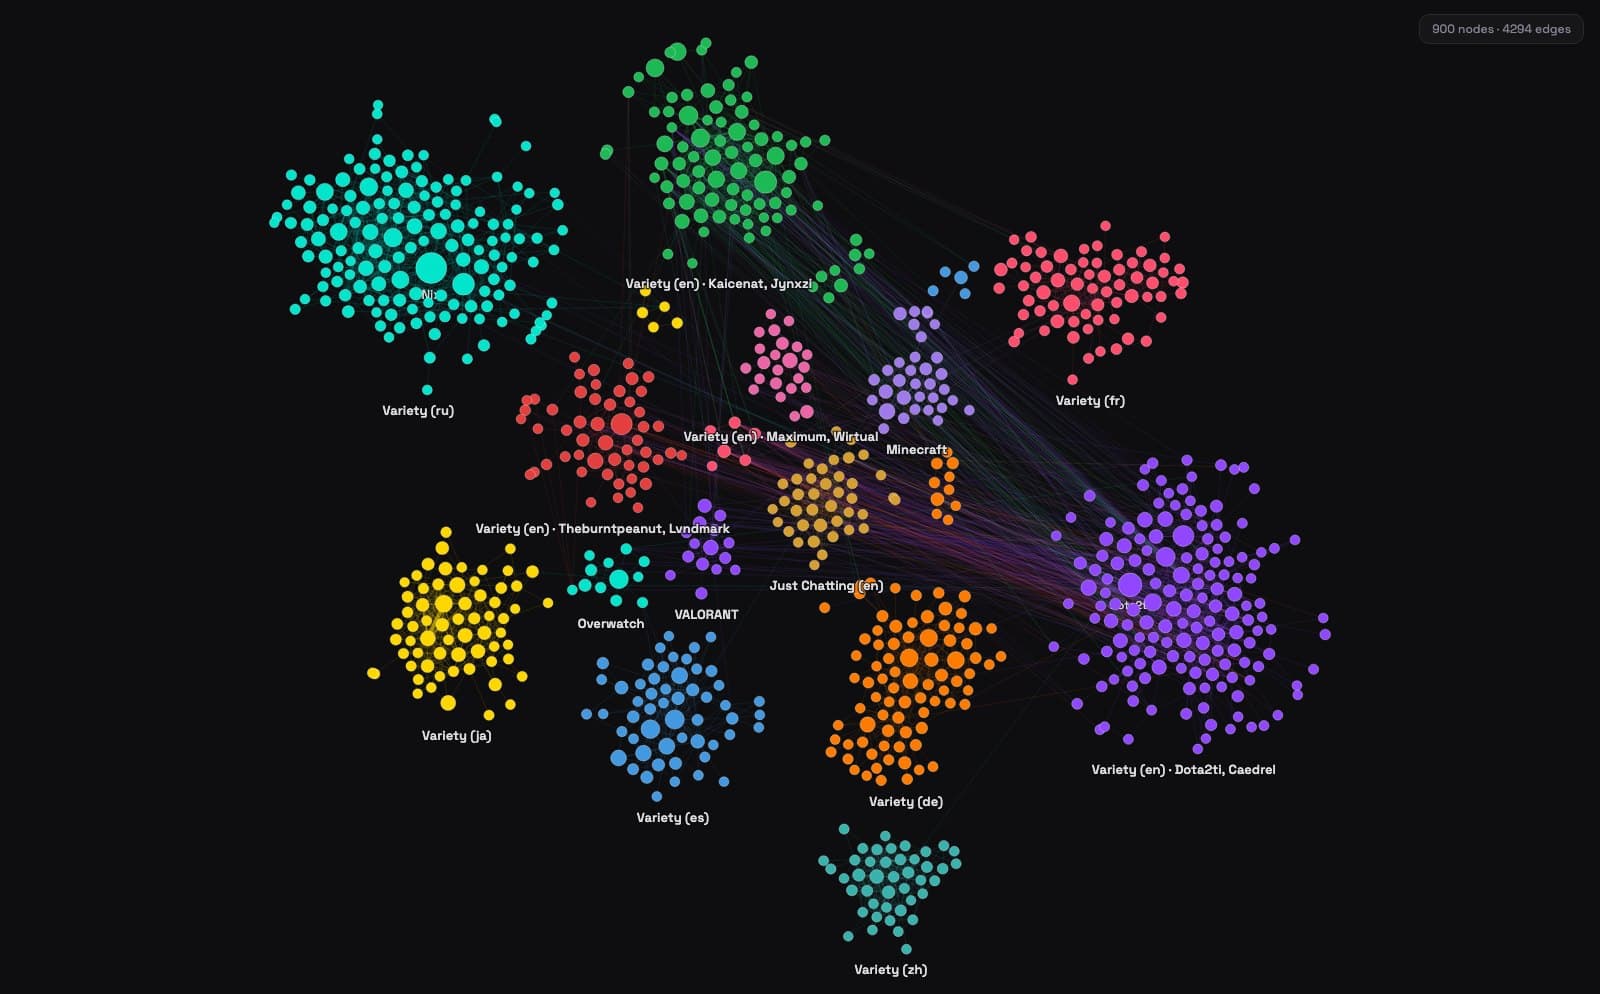
ViewerAtlas community map: 900 Twitch channels drawn as colored dots in about twenty clusters, labeled by community, such as Variety (ru), Variety (ja), and Variety (en) · Dota2ti, Caedrel.
Fig. 1The 14-day map: 900 of the 2,748 analyzed channels, colored by community. Rendered from the pipeline's public output for Aug 13–26, 2026.
surveys3 a day, Aug 13–26, 2026
42
distinct chattersafter removing 229 automated accounts
897,865
channels in the graphlinked by 12,523 shared-audience edges
2,748
communitiesLouvain, modularity 0.81
36

What I found

Four results from the 14-day window. Each chart has a table of the numbers behind it.

Finding 01

Language draws the biggest lines

Every one of the 36 communities has a dominant language or game, even though neither goes into the community detection. 23 share a broadcast language on at least 40% of their channels, and together they hold 2,455 of the 2,748 channels. The other 13 form around a single game, like Minecraft or VALORANT.

The communities are also tight: 88% of the graph's 12,523 edges connect channels in the same community. Lining up with labels the algorithm never saw is a good sign that the overlap signal carries real structure. It doesn't explain why audiences cluster this way.

Of 2,748 channels, 2,455 (89%) are in the 23 communities that share a language, and 293 (11%) are in the 13 communities built around one game.

Show the numbers
Channels by community type
Community typeCommunitiesChannelsShare
Shared language (40%+ of channels)232,45589.3%
Single game (60%+ of channels)1329310.7%
Total362,748100%

Finding 02

English-language channels split by game

Among communities where no single game dominates, Russian, German, French, Spanish, Chinese, and Japanese channels each form one. English forms six, with 920 channels between them, and each of the six has its own mix of games.

The largest centers on League of Legends and Counter-Strike, and its biggest channels are Caedrel and Dota2ti, which was broadcasting The International during the window. The others center on IRL streams and Fortnite, on Escape from Tarkov, and on World of Warcraft and Path of Exile. The table lists all six.

English also has the most channels in the sample, which gives it more room to split. So this describes the map, and I wouldn't read it as a claim about English-speaking viewers without more data.

Communities where no single game dominates, grouped by main language. English has six communities with 920 channels. Russian, German, French, Spanish, Chinese, and Japanese have one each, with 368, 221, 167, 144, 132, and 132 channels. Portuguese has two, and Italian and Ukrainian have one each.

Communities where at least 40% of channels share a broadcast language and no game reaches 40%. Number of communities in parentheses.

The six English communities

  • 459 channelsMost common games: League of Legends, Counter-Strike, DeadlockLargest channels: Dota2ti, Caedrel
  • 165 channelsMost common games: IRL, Fortnite, Rainbow Six SiegeLargest channels: Kaicenat, Jynxzi
  • 141 channelsMost common games: Escape from Tarkov, Marvel Rivals, Apex LegendsLargest channels: Theburntpeanut, Lvndmark
  • 99 channelsMost common games: World of Warcraft, Path of Exile, Old School RuneScapeLargest channels: Maximum, Wirtual
  • 29 channelsMost common games: Pokémon FireRed/LeafGreen, Elden RingLargest channels: Captain_domo, Lilaggy
  • 27 channelsMost common games: EA Sports FC 26, Call of Duty: WarzoneLargest channels: Angryginge13, Auziomf

Games leave out Just Chatting, which is the most common category in the two largest communities.

Show the numbers
Variety communities by main language
LanguageCommunitiesChannelsCommunity sizes
English6920459, 165, 141, 99, 29, 27
Russian1368368
German1221221
French1167167
Spanish1144144
Chinese1132132
Japanese1132132
Portuguese27159, 12
Italian12121
Ukrainian11212

Finding 03

229 accounts made up 97% of the raw overlap

Chat bots post in many channels, so each one links every pair of channels it appears in. Over the 14 days, 229 automated accounts, 0.03% of all chatters, supplied 97% of the shared-chatter counts between channel pairs. StreamElements and Nightbot alone chatted in 2,903 and 2,801 channels.

Left in, they would have added 681 edges that exist only because of bots. I remove them at analysis time with two rules: a list of known bot services, and a flag for any account chatting in more than three channels during the same five-minute window. The cutoff comes from the data. Accounts active in one or two chats at once looked like everyone else, while 72% of those active in four came from one narrow band of recently created account IDs.

229 automated accounts were 0.03% of all chatters but supplied 97% of the shared-chatter counts between channel pairs.

Show the numbers
Automated accounts in the 14-day window
MeasureValue
Automated accounts removed229
Share of distinct chatters0.03%
Shared-chatter counts they supplied8,630,829 (97.0%)
Edges that exist only because of them681 of 13,736 (5.0%)
Channels StreamElements chatted in2,903
Channels Nightbot chatted in2,801

Finding 04

Most chatters show up in only one channel

86% of the 897,865 chatters appeared in just one surveyed channel. Every edge in the graph comes from the roughly 122,000 who appeared in two or more.

That's why overlap counts are small, and why I treat them as lower bounds on the true shared audience. A five-minute sample only catches the people who happened to chat in it.

Of 897,865 chatters, 86.4% were seen in only one channel and 13.6%, about 122,000, in two or more.

Show the numbers
Chatters by number of channels
Chatters seen inShareCount
One channel86.4%about 776,000
Two or more channels13.6%about 122,000
All chatters100%897,865

From chat samples to communities

Collection, analysis, and the website run as separate one-shot jobs that only share data through S3. The bars show how many channels are left after each step.

  1. 01

    Survey

    At 6:00, 14:00, and 22:00 Eastern, a job takes the roughly 1,200 most-watched live channels and records who chats in each during one shared five-minute window. It keeps user IDs and logins, never message text.

    11,835 channels across 47,864 channel samples

  2. 02

    Clean and filter

    Remove automated accounts, then keep channels seen at least 3 times with at least 10 chatters. A channel seen once is a single five-minute sample and can't give a reliable overlap.

    5,082 channels, after removing 229 automated accounts

  3. 03

    Build the graph

    Link two channels when they share at least 3 chatters across the 14-day window. The edge weight is the number of shared chatters.

    3,246 channels, 13,055 edges

  4. 04

    Find communities

    Run Louvain with a fixed seed and drop communities under 10 channels, which are mostly noise. Label each community by the language or game most of its channels share.

    2,748 channels in 36 communities, modularity 0.81

  5. 05

    Publish

    Export channel-level aggregates only: the 1,000 most-watched channels, each with its 25 strongest links, drawn with a precomputed layout.

    900 channels, 4,294 edges, 19 communities on the map

Decisions that shaped the results

The choices that most affect what the map shows, and the reasoning behind each.

Measuring the edge threshold on my own data

Twitch Atlas, the 2020 map that inspired this project, linked channels whose hourly viewer lists overlapped by more than 300 people. On five-minute chat samples, 300 produced no edges at all, so I swept thresholds on my own data and compared the graphs.

Modularity peaked at 10, but it was nearly as high at 3, and far more channels stayed connected. Modularity rises as a graph gets sparser, so its peak overshoots what a map needs. I chose 3, the knee of the curve and the 90th percentile of pair overlaps.

Threshold sweep on the 14-day window
14-day windowThreshold 3 · chosenThreshold 10
Modularity0.8300.840
Channels still connected64%27%
Channels on the published map899654

These were measured before the bot filter existed. Re-running the sweep with the filter on is the first item on the roadmap.

Rules run at analysis time

Raw survey files are never rewritten. Bot filtering, windows, and thresholds are applied during analysis, so a corrected rule reaches every stored survey on the next run. The bot classification itself is never saved, since a behavioral rule can misjudge a person.

Equal sampling windows

Every channel in a batch is sampled over the same 300 seconds, and a batch that loses its connection is rerun from scratch. That keeps samples comparable within a survey. It replaced an earlier IRC collector that ran continuously.

Reproducible runs

Louvain runs with a fixed seed, and nothing in the pipeline depends on Python's hash seed. Three runs with different hash seeds gave identical public and private outputs.

Checked on known structure

On synthetic surveys with 8 planted communities, the production settings recover all 8, and the bot filter removes the planted bots and a coordinated account farm. That shows the method finds structure that exists. It says nothing about Twitch itself.

Private by default

Raw files hold Twitch user IDs and logins, so they stay in a private bucket and expire after 100 days. The public site only gets channel-level aggregates, and a check after every deploy confirms that no public file contains a chatter's identity.

Exploring the results

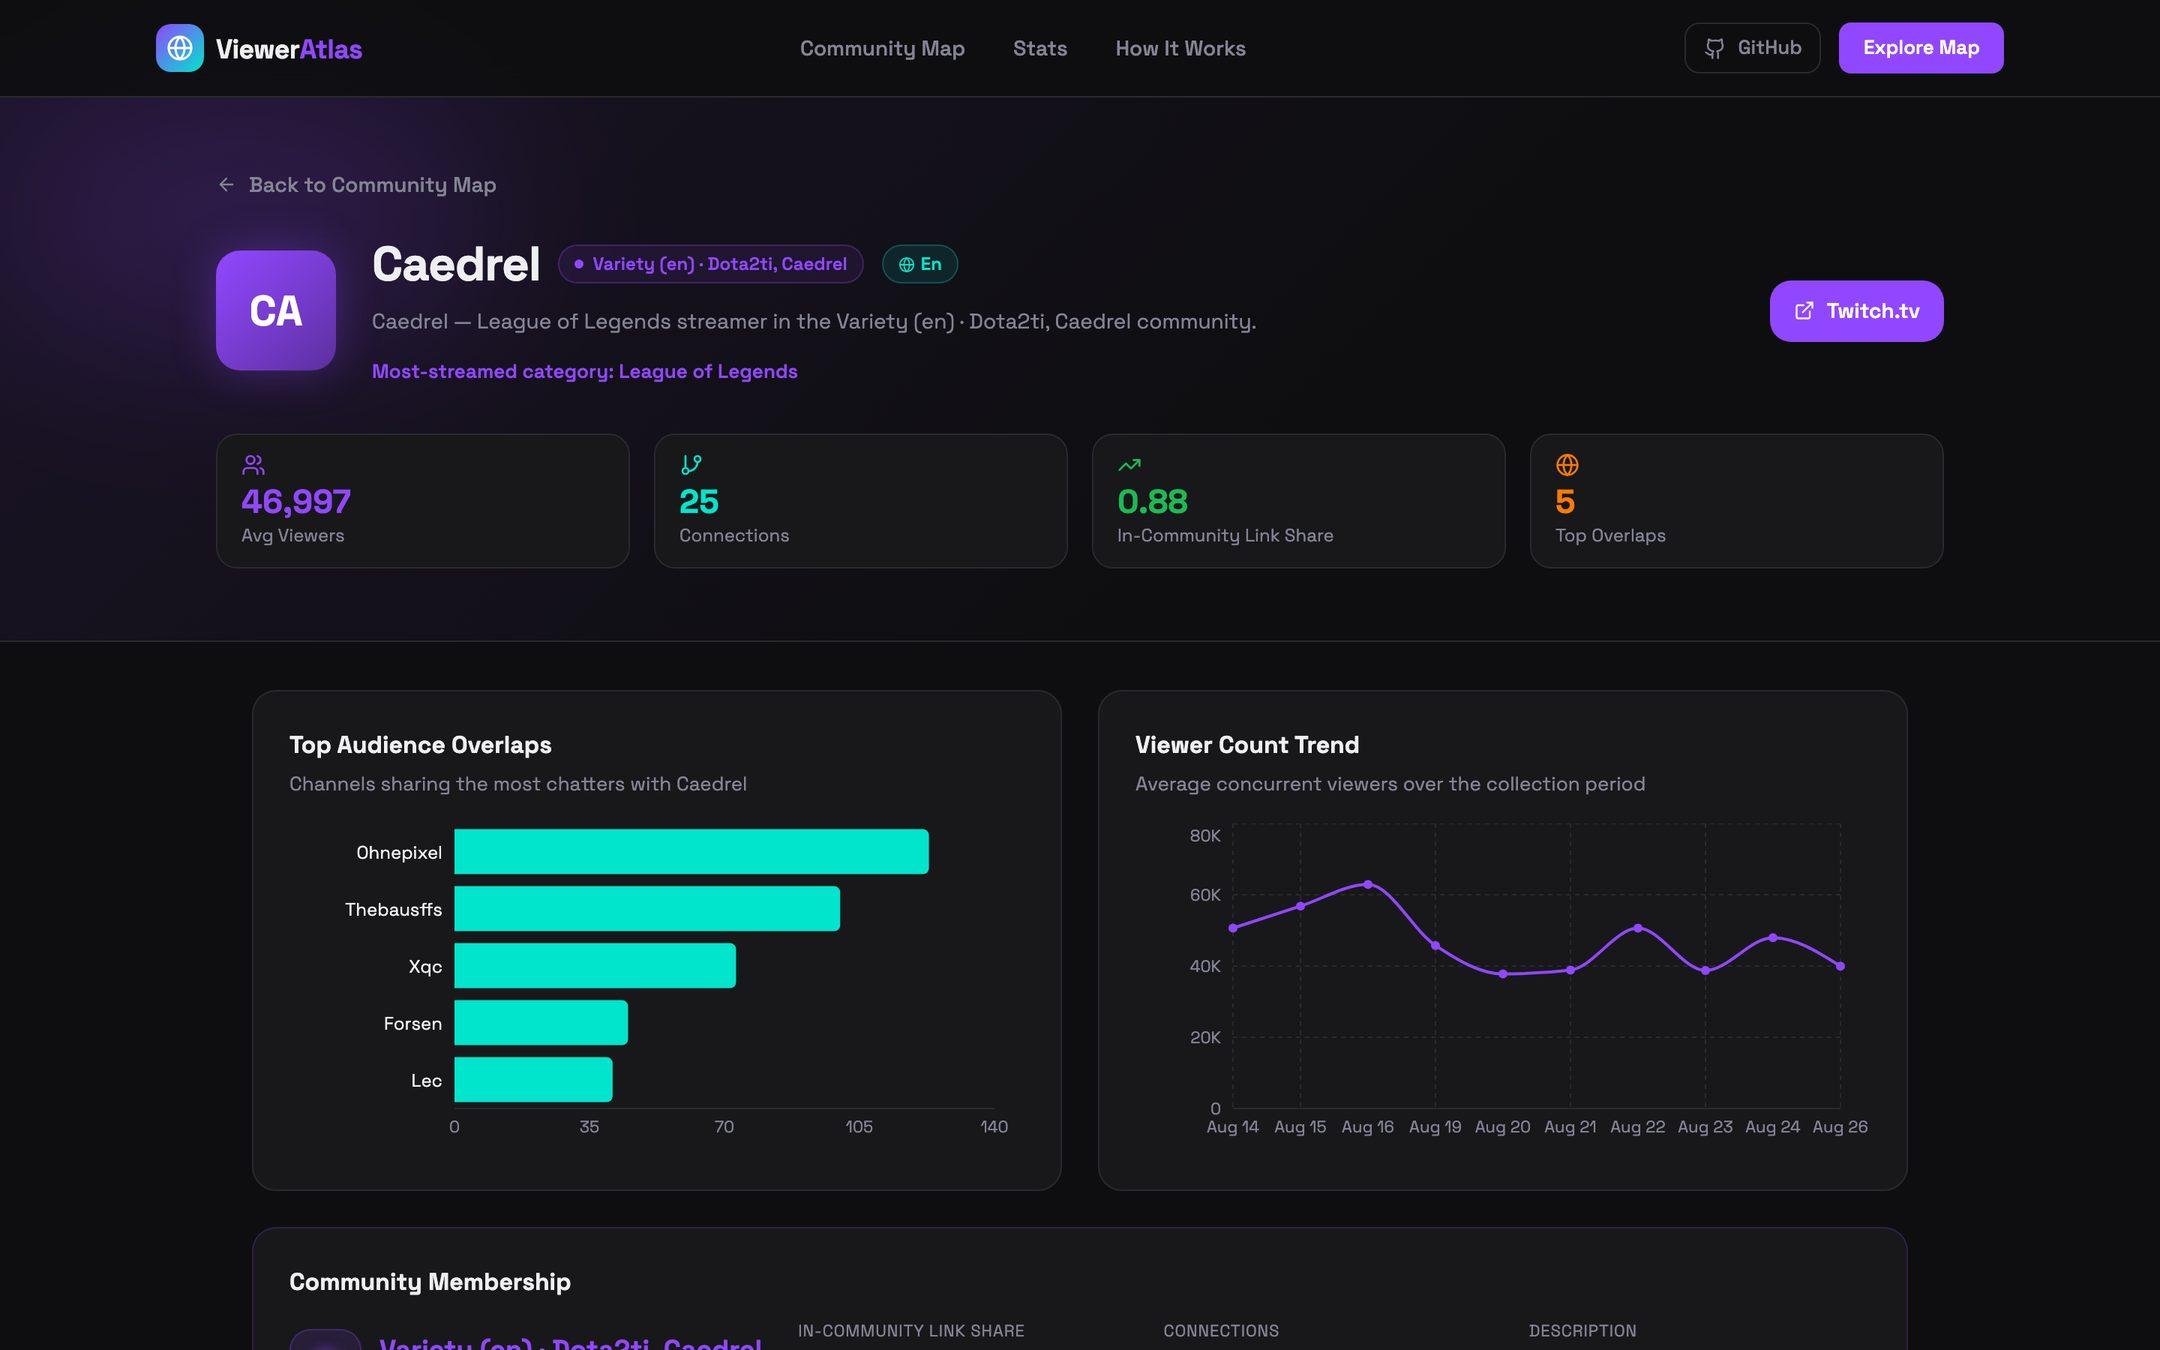
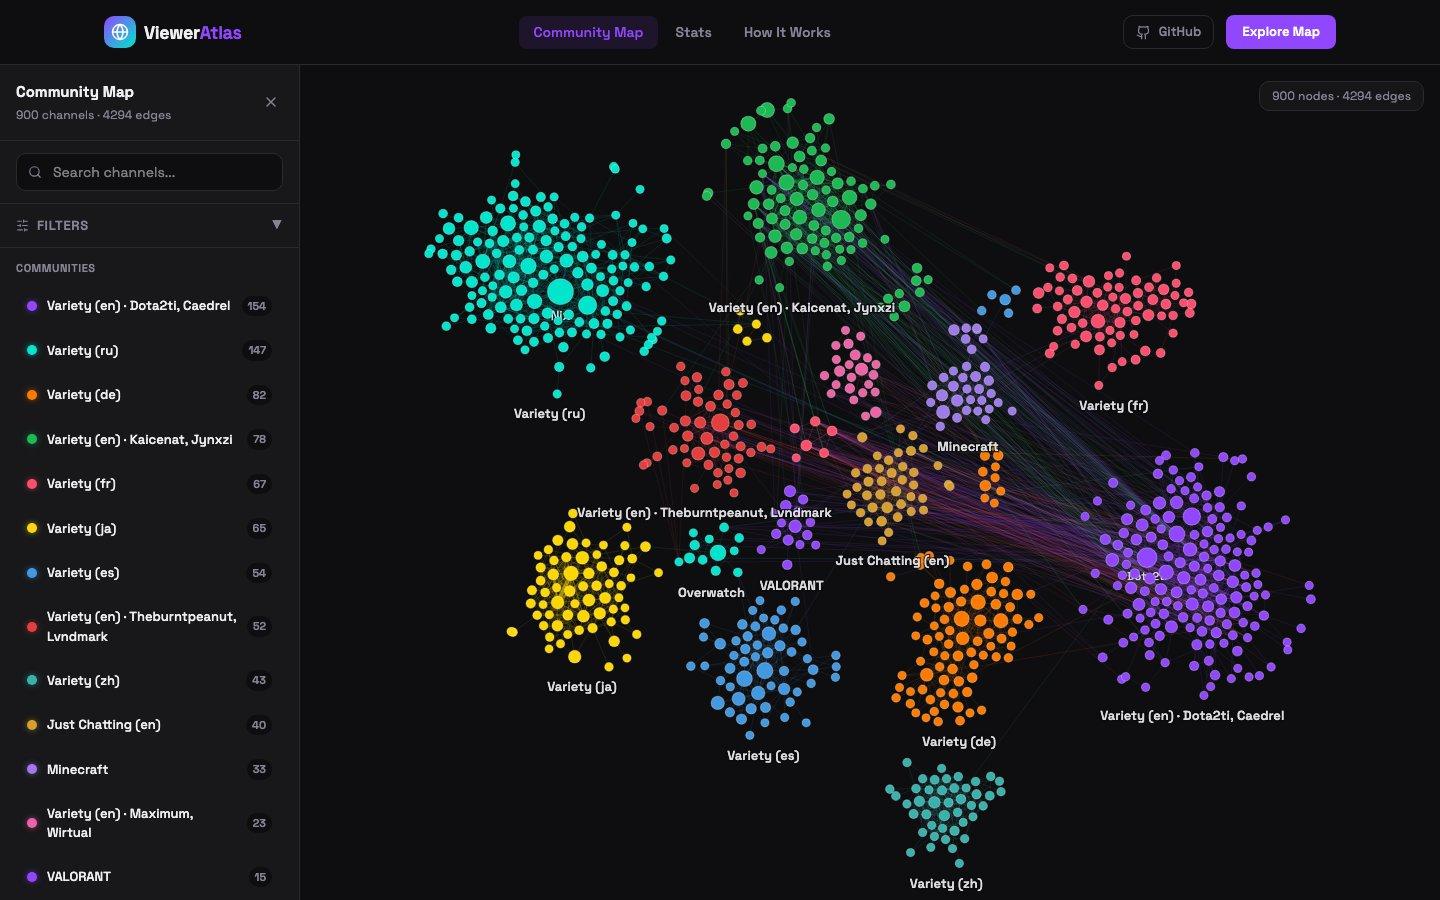
The map is part of a React explorer at vieweratlas.space, with channel search, filters for community, language, and audience size, and a switch between the rolling 14- and 30-day windows. Each channel gets a page with the channels it shares the most chatters with and its viewer trend.

ViewerAtlas channel page for Caedrel: 46,997 average viewers, a bar chart of the top audience overlaps with Ohnepixel, Thebausffs, Xqc, Forsen, and Lec, and a line chart of average viewers from Aug 14 to Aug 26.
A channel page. Caedrel shares the most chatters with Ohnepixel, Thebausffs, and Xqc, and averaged about 47,000 viewers across the window.
The ViewerAtlas explorer: a sidebar with channel search, filters, and a list of communities with their channel counts, beside the community map.
The explorer, with search, filters, and the community list beside the map.

Limitations

What the data can't support. I'd want anyone using the map to read these first.

  • It only sees chatters. People who watch without chatting are invisible, so chat-heavy channels and cultures are over-represented.

  • It's a sample. Three five-minute windows a day at fixed Eastern times, across the top 1,200 or so channels. Smaller channels and other time zones are under-covered.

  • Counts depend on sampling. Overlap counts grow faster than the number of surveys and partly reflect how often a channel was sampled, so they only compare pairs within one window.

  • Bot removal is a heuristic. It can drop a rare person who chats in four or more channels at once and can miss bots that aren't on the list. Chatters are matched by login, so a renamed account counts twice.

  • Thresholds need re-measuring. The 14- and 30-day thresholds were set before the bot filter existed. Filtering moved the overlap distribution, so every window needs a new sweep.

  • It shows where, and nothing about why. The map shows where audiences overlap. It doesn't measure raids, recommendations, or audiences moving between channels.

  • The map is a projection. The public map shows the 1,000 most-watched analyzed channels with at most 25 links each, so smaller channels and weak ties are hidden.

How it's built

For technical reviewers. Nothing runs continuously: scheduled one-shot jobs collect, analyze, and publish.

Pipeline
Python 3.11 with TwitchIO (EventSub), pandas, PyArrow, NetworkX, and python-louvain. 272 pytest tests that run without network access or credentials.
AWS
EventBridge Scheduler starts one-shot ECS Fargate tasks. Data sits in a private S3 data lake with lifecycle expiry, a DynamoDB lease prevents overlapping surveys, and CloudFront serves the site.
Explorer
React 18, TypeScript, and Vite. The page validates every data payload field by field before drawing it.
CI
Tests, type checks, and a frontend build on every push, plus pip-audit, Bandit, npm audit, and Dependabot.
Workflow
I wrote the pipeline and the explorer with help from AI coding assistants. The research question, what data is collected and published, the analysis rules, and how the results are read are my decisions.